Last Updated on June 9, 2023 by Tony Fowler
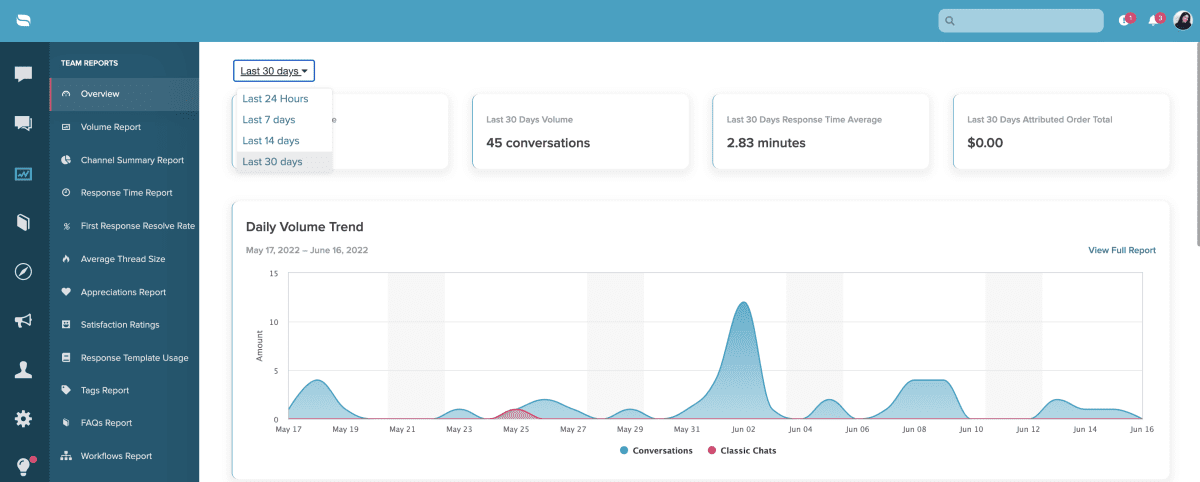
In reports, you now have the option to choose between multiple date ranges for the charts generated on that specific reporting page. Reporting is an essential element to a business to help present information needed to measure sales, customer satisfaction, and more! We know it is beneficial to break up this key information not only by the data type but the time frame to help develop future forecasts. The time range selection now varies from 24 hours, 7 days, 14 days, and 30 days on the Reports Overview page.
When you are in the reporting dashboard the Overview page is where you will be able to adjust and change the date range of when you want your reports to reflect. This selection will then be generated on the other reports you pull unless changed to a different range.
So for example, if you select the time frame to generate for the past 24 hours on the “Overview” page, then go to the “Response Time Report” page you will see data from the past 24 hours reflected within the charts on the page unless specified otherwise. Here is a preview of the dashboard and what you can expect. You are able to start running these reports in your account now!